Quick Menu
System Stability
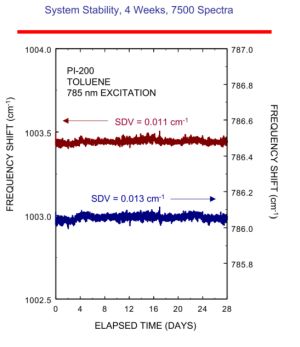
System Stability, 4 Weeks, 7500 Spectra
The mechanical components of a Raman system can move slightly with changes in ambient temperature. These small mechanical movements can alter the relationship of the CCD pixel position to our predetermined wavelength calibration and would cause the Raman spectral band locations to shift slightly in position with changes in ambient temperature from winter to summer. For this reason we have an auto calibration feature that will automatically produce a neon calibration of the instrument at predetermined times. A second feature that can create alterations to the initial calibration is the temporal wavelength stability of the excitation laser. To independently monitor the excitation wavelength, the PROspectTM software uses the peak position of a known chemical standard in the process stream to automatically adjust the wavenumber calibration to internally correct for any fluctuations that might occur in the wavelength of the excitation laser. The four week study looked at two different 50/50 toluene-acetonitrile solutions on two separate multiplexer channels. Determination of the mean, FWHM, and amplitude of a Raman band was accomplished by fitting each peak to a Gaussian/Lorentzian Equation. The figure to the right displays the fitted mean for toluene’s two strongest Raman bands at 786 cm-1 and 1003.5 cm-1 during the four week stability experiment. Each of the fitted means had a standard deviation (SDV) of ~ 0.015 cm-1 . This demonstrates that our instrument has the ability to distinguish small spectral band shifts down to a few hundredths of a wavenumber.

