Quick Menu
Low Level Detection
Raman is able to discern a low level presence in many mediums. Listed below are some examples of low level measurements.
Nitrate added to Aqueous Solution
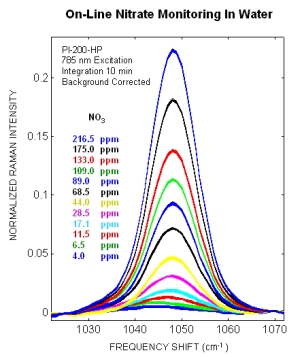
The spectral response from trace concentrations of sulfate in an aqueous solution are displayed to the right, and the observed spectral responses were initially background corrected. A PI-200-HP spectrograph containing high performance lenses and a deep depleted CCD was used for this study. The change in peak intensity is easily distinguishable down to the single digit ppm range.
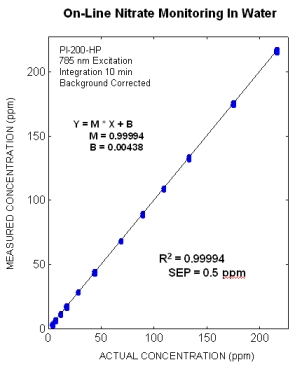
Comparisons between the actual and predicted nitrate concentrations in an aqueous solution are displayed on the right. The standard deviation from the (actual – predicted) concentrations was 0.5 ppm and the linear relationship had a correlation coefficient of 0.999.
Trace Detection of Benzene in a Hydrocarbon
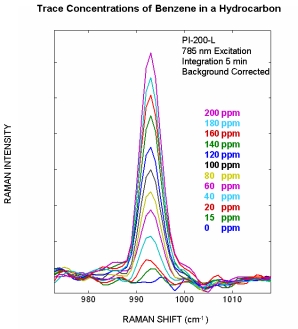
The spectral response from trace concentrations of benzene in isopropyl alcohol are displayed to the right, and the observed spectral responses were initially background corrected. A PI-200 spectrograph containing high performance lenses was used for the benzene monitroing. Lower detection limits, down to the 5 ppm range, could be easily obtained by using our high performance CCD, increasing laser power, or increasing the sample integration time.
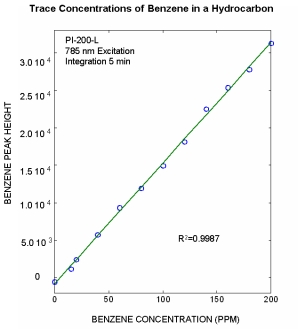
The figure to the right displays the linear relationship between the benzene peak intensity and the benzene’s concentration in a hydrocarbon. The linear relationship has a correlation coefficient of 0.9987.
Trace Detection of Propylene Glycol in Water
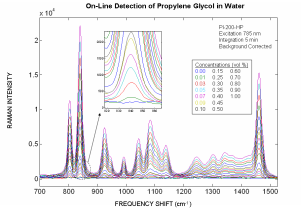
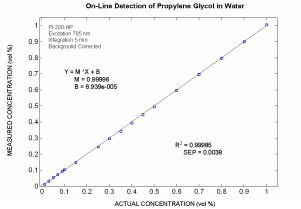
The spectral response from trace concentrations of propylene glycol in an aqueous solution are displayed to the right, and the observed spectral responses were initially background corrected. A PI-200-HP spectrograph containing high performance lenses and a deep depleted CCD was used for this study. The change in peak intensity is easily distinguishable down to the double digit ppm range.

