Quick Menu
Measure Both Neat and E10 Properties
Raman allows online measuring of E-10 properties directly at the Blend Header.
- Regulations now require ethanol to be blended with gasoline prior to transport
- Normally, grab samples are collected, blended with ethanol, and sent to the lab for analysis
- This results in hours of delay
- Normally, grab samples are collected, blended with ethanol, and sent to the lab for analysis
One year case study of Raman instrument measurements
- 320 samples are collected over one year to ensure inclusion of seasonal and crude slate changes
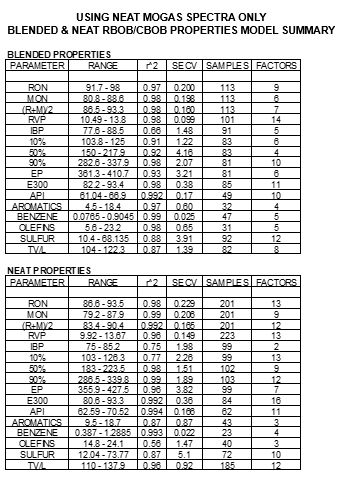
- Chemometric models were developed using only neat Raman spectra
- Model training set built using 90% of spectra
- Remaining 10% set aside as an independent validation data set
- Standard error of cross-validation (SECV) for the ROAD E10 partial least-squares (PLS) regression analysis using six factors
- 0.205 octane units
- Standard error of prediction (SEP) for ROAD E10 for validation data set
- 0.222 with no outliers
- Online predictions for other key E10 properties, including
- Reid vapor pressure (RVP)
- Distillation points
- E-200 and E-300
- Aromatics
- Benzene
- Olefins
- Temperature for vapor/liquid ratio (TV/L)
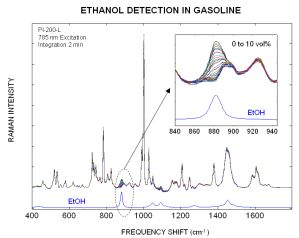
Process Instruments has developed an application for measuring ethanol being blended into gasoline. The spectra to the right are from a gasoline sample with increasing ethanol concentrations (0 – 10 vol%). An intensity scaled ethanol spectrum is also displayed for reference (lower blue curve). The insert plot shows the dominant ethanol 882 cm-1peak is easily detected in a gasoline spectrum and can be used to determine the amount of ethanol in gasoline.
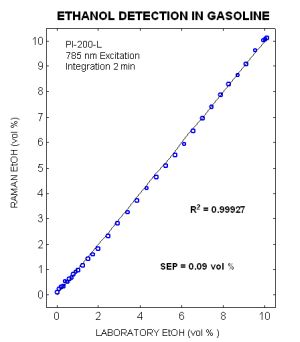
Comparisons between the actual and predicted ethanol concentrations in gasoline are displayed on the right. The standard deviation from the (actual – predicted) concentrations was 0.09 vol% and the linear relationship had a correlation coefficient of 0.9993. The Raman predictions were determined from the 882 cm-1peak heights. A standard PI-200-L spectrograph was used for this study. Lower detection limits, down to the 500 ppm range, could be easily obtained by using our high performance CCD, increasing laser power, or increasing the sample integration time.


