Quick Menu
Amine Monitoring
Process Instruments Inc. manufactures an optical fiber based Raman scattering instrument for realtime, online analysis of amine processes used to remove acid gases (H2S and CO2) from hydrocarbon streams. Raman analysis is well suited to amine monitoring and control for several reasons: 1.) Raman scattering requires little if any sample conditioning, 2.) The high resolution Raman spectra of amine solutions allow the various components (amine, H2S, and CO2) to be distinguished and quantified, 3.) Working in the NIR region allows for fiber-optic coupling of the sample stream probe and the Raman analyzer, and 4.) Working with optical fibers allows for multiplexing many individual Raman probes to one single Raman instrument, reducing instrument calibration and simplifying overall maintenance. Continuous in situ monitoring of all the critical amine parameters: amine concentration, H2S, and CO2 levels can provide almost instantaneous feedback on important changes in the amine process which can lead to real time process control, improved finished product quality, reduced overall cost, and minimized waste.
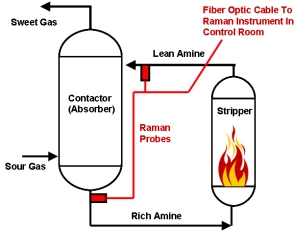
A schematic representation of a typical amine process with the locations of the Raman probes used to monitor the rich and lean amines shown in red is displayed to the right. The Raman instrument is designed to be located in a centralized control room and is connected to the different fiber optic cables associated with each Raman sample probe. Raman has an advantage over infrared in that there is no interference from water so the probe can be directly inserted into a process stream. Infrared requires a sample conditioner. A single Raman system can be multiplexed up to 18 channels/streams.
Acid Gases in Amines
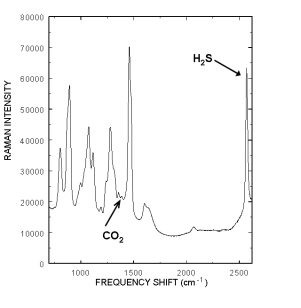
The Raman spectrum of a typical rich amine s ample containing CO2 and H2S is displayed to the right. The Raman peak located at 2570 cm-1 is from the H2S and the 1387 cm-1 peak is from CO2. The fact that intensity from each acid gas peak is linearly proportional to the gas’s concentration allows chemometric techniques such as Partial Least Squares (PLS) to model all of the spectral variations and correlate them to concentrations. Current, standard laboratory practice requires laborious titration of grab samples to determine amine, H2S and CO2 levels in both the rich and lean amine streams. Many laboratory measurements have to be performed to properly control and monitor the amine streams. Consequently the amine streams are often not efficiently used, at great expense to the refinery, natural gas provider, and power plant. Real time monitoring would also eliminate the formation of unknown excessive acid gas concentrations that form acid solutions in the aqueous stream and damage critical plant infrastructure.
CO2 Monitoring
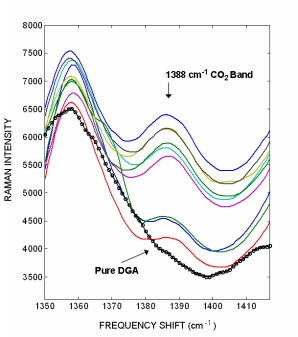
Raman spectra from a pure DGA amine sample with no CO2 adsorbed (black circles) and on-line grab samples containing different CO2 concentrations (colored lines). The CO2 1387 cm-1 Raman band has a signal intensity that is c.a. 4.5 times less then the H2S band. The nine DGA amine samples we analyzed did not have laboratory CO2 concentrations. The figure to the right illustrates how the CO2 peak is not observed in the pure DGA sample and that the peak intensity varies within the nine DGA samples. The varying intensity indicates that Raman analysis can easily distinguish different CO2 concentrations.
CO2 Sequestration
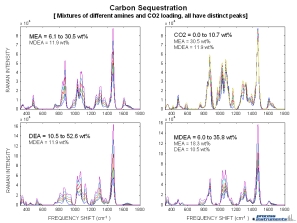
Raman spectra from mixtures of different amine streams (MEA, MDEA, DEA) and CO2 all at different concentrations are displayed to the right. Each subplot shows a varying concentration of a single component while the other component’s concentrations remain constant. Distinct spectral features for each of the different components can be observed, and indicate that Raman spectroscopy can be used for on-line monitoring of streams containing multiple amine species.
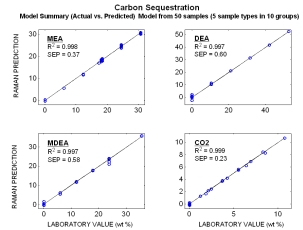
Typical online results for the combined amines (MEA, MDEA, DEA) streams with various CO2 loading. The plot shows Raman predicted concentrations vs. the measured laboratory concentrations. Even though these models were generated with a limited number of samples (50 total), their standard errors of predictions (SEP) are comparable to most conventional laboratory techniques.
DGA Monitoring
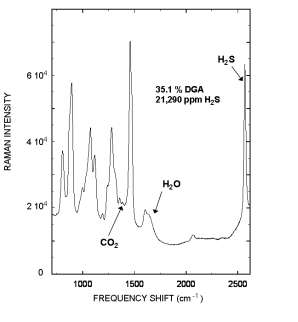
Raman spectrum of a rich Diglycolamine (DGA) sample that contained 35.1 % DGA, and 21,290 ppm H2S is displayed to the right. The Raman peak located at 2570 cm-1 is from the H2S and the 1387 cm-1 peak is from CO2.
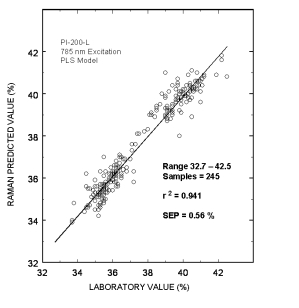
Typical online partial least squares (PLS) analysis of the DGA concentrations. The plot shows Raman predicted values vs. the measured laboratory values. The standard error of prediction for the PLS model with outliers removed was 0.56 %.
H2S Monitoring
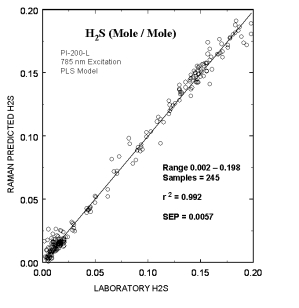
Typical online partial least squares (PLS) analysis of the H2S (mole/mole) concentrations. The plot shows Raman predicted values vs. the measured laboratory values. The standard error of prediction for the PLS model with outliers removed was 0.0057.
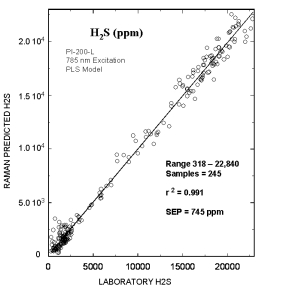
Typical online partial least squares (PLS) analysis of the H2S (ppm) concentrations. The plot shows Raman predicted values vs. the measured laboratory values. The standard error of prediction for the PLS model with outliers removed was 745 ppm.
MDEA & DGA Spectra
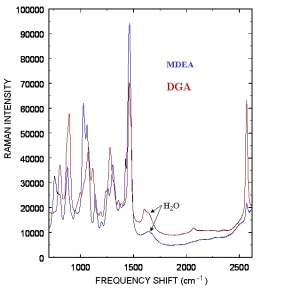
Typical Raman spectra from Methyldiethanolamine (MDEA) and Diglycolamine (DGA) amines used to remove acid gases are displayed to the right. The weak water Raman band around 1650 cm-1 indicates minimal interference from water allowing the probe to be directly inserted into a process stream. The five commonly used amines to remove acid gases are listed below, and the amines we have currently monitored are marked with an *:
– Monoethanolamine (MEA)
– Diethanolamine (DEA)
– Methyldiethanolamine (MDEA)*
– Diisopropylamine (DIPA)
– Diglycolamine (DGA)*
Each amine has special attributes depending upon the specific application. Some are more efficient in adsorbing CO2, some better with removing H2S, etc. Unique Raman spectra are associated with each of the amines allowing one instrument to easily monitor the different amine streams.
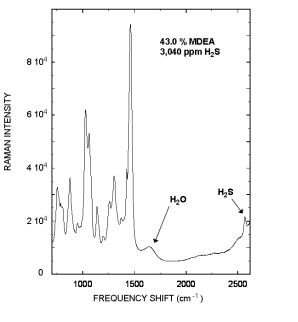
Raman spectrum of a rich Methyldiethanolamine (MDEA) sample that contained 43.0 % MDEA, and 3,040 ppm H2S is displayed to the right.
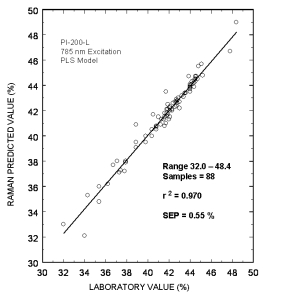
Typical online partial least squares (PLS) analysis of the MDEA concentrations. The plot shows Raman predicted values vs. the measured laboratory values. The standard error of prediction for the PLS model with outliers removed was 0.55 %.
Amine Modeling Results
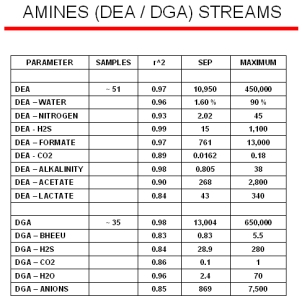
Typical online results for two different amine streams (DEA and DGA) from a model that was built with ~ 50 samples are displayed to the right. The SEP (Standard Error of Predictions) column is the standard deviations between the laboratory minus the Raman predicted values. The maximum value for each of the parameters are shown in the last column. Even with a model containing a limited number of samples, the Raman predicted values are nearly equal to the standard laboratory measurements.
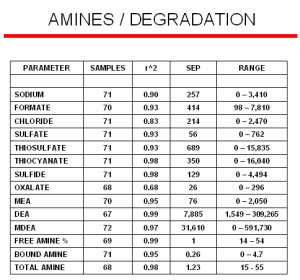
The accumulation of Heat Stable Salts (HSS) or other contamination products in amine streams create operational problems such as capacity reduction or corrosion. Many of the degradation products are hard to detect since they often titrate as amines, and so a refiner might think a solution is more active than it really is. Our Raman analyzers have the ability to detect the onset of formation of these degradation products at trace levels before they start deteriorating the amine performance. The modeling results for many of the degradation products are displayed to the right. Even though these models were generated with a limited number of samples, their standard errors of predictions (SEP) are comparable to most conventional laboratory techniques.

